Electrocardiography (ECG or EKG) is a simple, non-invasive test that records the heart’s electrical activity using small electrodes placed on the skin. These signals produce waveforms like the P wave, QRS complex, T wave, and occasionally the U wave, which represent different phases of the heart’s electrical and mechanical cycle.
Understanding these key waves is crucial because they reveal vital information about heart rhythm, timing, and performance. Each wave plays a unique role in showing how the electrical signal moves through the heart and how the heart responds. If you’re learning to read these patterns, especially for clinical settings, check out our guide on ECG rhythm recognition and interpretation for ACLS to deepen your understanding and build confidence in interpreting ECGs accurately.
1. Key ECG Waves
Each ECG wave reflects a specific phase of the heart’s electrical activity, offering critical clues about its rhythm and function.
1a. The P Wave: Atrial Depolarization
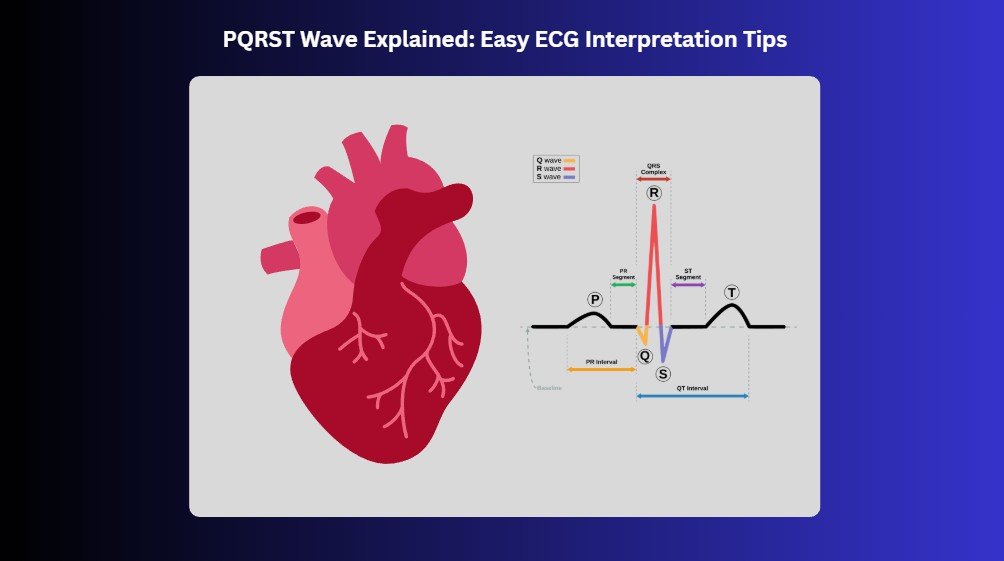
The P wave is the first small upward bump on an ECG, signaling the electrical activation of the atria. This causes them to contract and push blood into the ventricles. Abnormalities in the P wave’s shape or size can indicate atrial enlargement or rhythm disturbances, such as atrial flutter or ectopic atrial rhythms.
1b. The QRS Complex: Ventricular Depolarization
The QRS complex follows the P wave and marks the moment when the ventricles receive the electrical impulse to contract and pump blood to the body and lungs. A normal QRS is narrow and sharp. Widened or irregular QRS complexes may signal issues like bundle branch blocks, past myocardial damage, or electrolyte imbalances.
1c. The T Wave: Ventricular Repolarization
After contraction, the heart needs to reset for the next beat. The T wave represents this recovery phase, ventricular repolarization. In most leads, a healthy T wave is upright and smooth. When it’s inverted, flattened, or unusually peaked, it may point to ischemia, electrolyte disturbances (like hyperkalemia), or other cardiac stressors.
1d. The U Wave: Delayed Repolarization (if present)
Not always visible, the U wave appears after the T wave and is best seen in leads V2 and V3, especially at slower heart rates. Though its exact origin isn’t fully understood, it’s thought to represent delayed repolarization of structures like Purkinje fibers. A pronounced U wave may suggest hypokalemia, bradycardia, or the effects of medications such as antiarrhythmics. When inverted or exaggerated, it could hint at more serious conditions like myocardial ischemia or ventricular hypertrophy.
2. Intervals, Durations, and What They Mean
Measuring the timing and duration of ECG waveforms and intervals is key to understanding how the heart conducts electrical impulses. Each part of the ECG, the P wave, PR interval, QRS complex, QT interval, and even the U wave, has a typical range that reflects healthy cardiac function. Deviations from these norms can signal a wide range of issues, from minor imbalances to life-threatening arrhythmias.
Here’s what to look for:
- P Wave Duration: Normally ≤ 0.12 seconds. A longer duration may point to atrial enlargement or delayed atrial conduction.
- PR Interval: Typically 0.12–0.20 seconds. A prolonged PR suggests first-degree AV block, while a short PR may be seen in pre-excitation syndromes like Wolff-Parkinson-White.
- QRS Complex Duration: Should be ≤ 0.10 seconds. A widened QRS may indicate a bundle branch block, ventricular rhythm, or electrolyte imbalance.
- QT Interval: Varies with heart rate, but usually < 0.44 seconds in men and < 0.46 seconds in women. A prolonged QT increases the risk for dangerous arrhythmias like Torsades de Pointes; a short QT may be linked to hypercalcemia or genetic conditions.
- U Wave Duration (if visible): Typically 140–200 ms. A prominent U wave can suggest hypokalemia, bradycardia, or drug effects, while inverted U waves might indicate ischemia or ventricular hypertrophy.
When analyzing an ECG, don’t skip these intervals and segments; they carry diagnostic weight. Comparing measured values to standard ranges can uncover subtle signs of dysfunction before symptoms appear. This step helps guide treatment decisions and ensures early intervention when needed.
3. Wave Morphology: What Normal and Abnormal ECG Patterns
The shape, size, and direction of each wave on an ECG, known as morphology, are powerful indicators of how well the heart is functioning. Every wave, segment, and interval has a standard appearance. By learning what’s “normal,” you can more easily recognize subtle changes that may reflect underlying heart problems.
3a. Normal Morphology and Ranges
- P Wave: Upright in most leads, smooth, and usually ≤ 2.5 mm in height.
- QRS Complex: Narrow (< 0.10 sec), sharp, and tall in amplitude.
- T Wave: Upright and slightly asymmetrical, with a gradual upstroke and a steeper downstroke.
- U Wave: Small and usually upright when present, best seen in V2–V3.
These waveforms provide a baseline for comparison. When a wave doesn’t look right—too tall, too wide, notched, or inverted—it may be the heart’s way of signaling a deeper issue.
3b. Common Abnormalities and Their Meaning
- Notched or Peaked P Waves: Can indicate atrial enlargement (right or left), often seen in conditions like pulmonary hypertension or mitral valve disease.
- Wide QRS Complexes: May suggest bundle branch blocks, ventricular rhythms, or hyperkalemia.
- Low-Amplitude or Fragmented QRS: Could indicate prior myocardial infarction or cardiac scarring.
- Tall, peaked T waves: Often associated with hyperkalemia.
- Inverted or Flattened T Waves: May point to ischemia, previous infarction, or ventricular strain.
- Prominent U waves are linked to hypokalemia, bradycardia, or the use of antiarrhythmic medications.
- Inverted U waves suggest myocardial ischemia or ventricular hypertrophy.
4. Step-by-Step ECG Interpretation
A structured approach to ECG interpretation helps ensure no detail is missed and supports accurate, confident clinical decisions.
4a. Determine the Heart Rate
Start by figuring out the heart rate; it sets the stage for everything else. A normal heart rate falls between 60 and 100 beats per minute (bpm). If it’s over 100 bpm, that’s considered tachycardia (too fast), and if it drops below 60 bpm, that’s bradycardia (too slow). Use the 300 method (300 divided by the number of large boxes between R waves) if the rhythm is regular. For irregular rhythms, count the number of R waves in a 6-second strip and multiply by 10. Knowing whether the rate is too fast, too slow, or just right helps you narrow down possible conditions early on and sets a solid foundation for the rest of your interpretation.
4b. Analyze the Rhythm
Next, take a good look at the rhythm. Ask yourself, is it regular or irregular? Do the P waves come before every QRS? Is the spacing between R waves consistent? A regular rhythm usually means things are under control, while irregular patterns suggest atrial fibrillation, ectopic beats, or other rhythm disturbances.
4c. Examine the P Wave
Now focus on the P waves. Are they present, upright, and consistent in shape? Each one should come before a QRS complex, indicating that the atria are firing properly. Abnormal P waves signal atrial enlargement or rhythm issues like atrial flutter or ectopic atrial rhythms.
4d. Analyze the QRS Complex
Look closely at the QRS complexes; this is where the ventricles do their work. A normal QRS should be narrow, usually less than 0.10 seconds. A wide or abnormal-looking QRS can point to a bundle branch block, ventricular rhythm, or even a pacing spike if the patient has a pacemaker.
4e. Examine the T Waves
Check the T waves next. Are they upright and smooth? Tall, peaked T waves suggest hyperkalemia, while inverted T waves could point to ischemia or previous infarction. Their shape and direction give you a glance into how the ventricles are recovering after contraction.
4f. Interpreting the ECG in Clinical Settings
Finally, put it all together and interpret the ECG in context. Match what you see on paper with what’s going on with the patient. Is the ECG consistent with their symptoms, history, and physical exam? The goal isn’t just to read waves and intervals; it’s to understand what the heart is telling you in real life.
Mastering ECG Interpretation for Better Cardiac Care
In summary, understanding the PQRST wave is a foundational skill for anyone learning ECG interpretation. Each waveform—P, QRS, T, and sometimes U—offers valuable insights into the heart’s rhythm, function, and potential problems like arrhythmias or electrolyte imbalances. While ECGs can seem complex at first, breaking them down makes interpretation more approachable and meaningful.
Looking to be prepared with life-saving skills? Bayside CPR offers quick, convenient lifesaving training. Get your AHA Standard certification in ACLS, BLS, PALS, CPR, or First Aid by completing a brief online course followed by a 30-minute, in-person skills session at one of our 60+ locations. You’ll walk out the same day with your official certification card, feeling confident and ready to act.